Calculate I-squared values and variance distribution for multilevel meta-analysis models
mlm.variance.distribution.RdThis function calculates values of I2 and the variance distribution for multilevel meta-analysis
models fitted with rma.mv.
Arguments
- x
An object of class
rma.mv. Must be a multilevel model with two random effects (three-level meta-analysis model).
Value
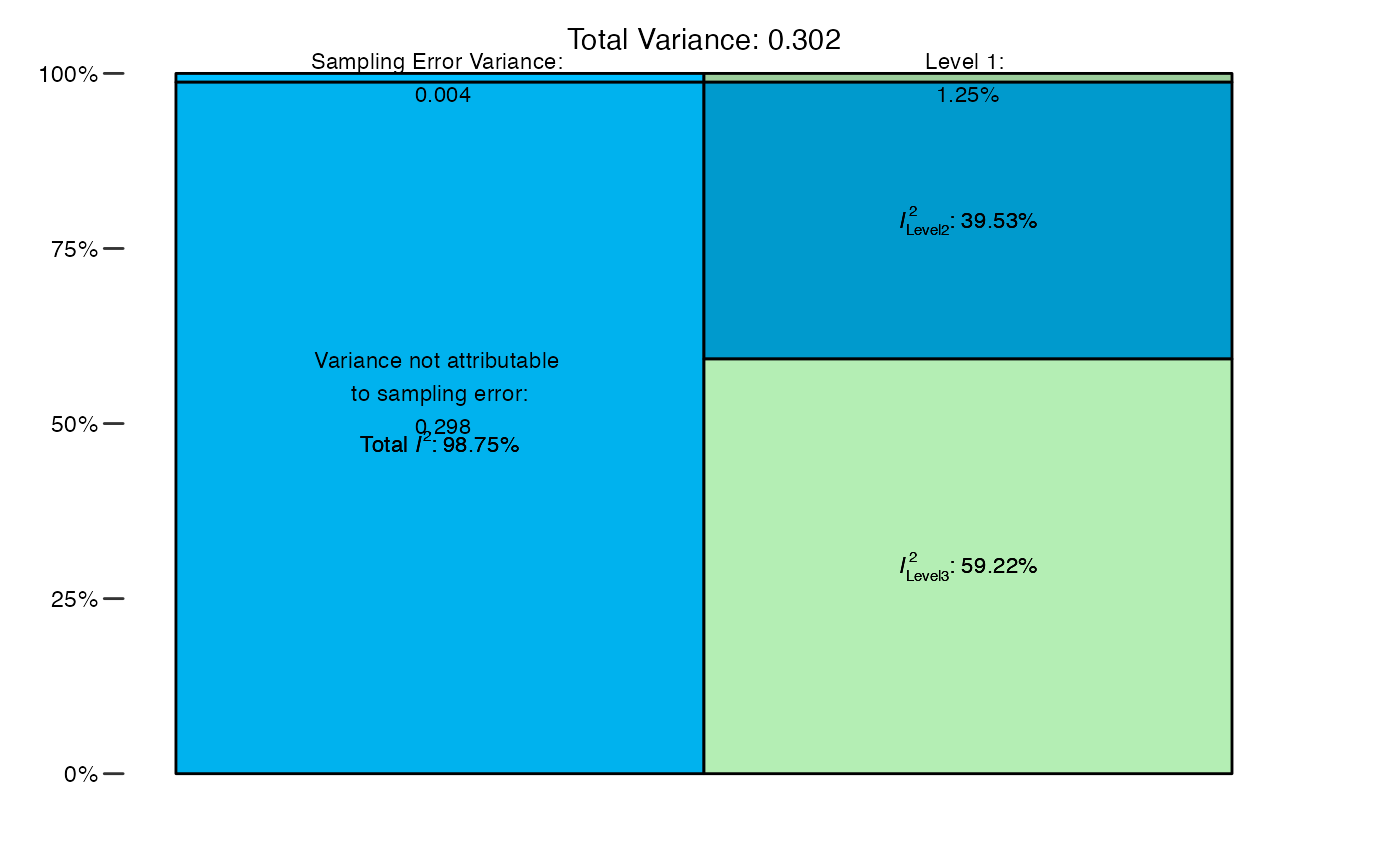
Returns a data frame containing the results. A plot summarizing the variance distribution and I2 values can be generated using plot.
Details
This function estimates the distribution of variance in a three-level meta-analysis
model (fitted with the rma.mv function). The share of variance attributable to
sampling error, within and between-cluster heterogeneity is calculated,
and an estimate of I2 (total and for Level 2 and Level 3) is provided. The function uses the formula by
Cheung (2014) to estimate the variance proportions attributable to each model component and to derive the I2 estimates.
References
Harrer, M., Cuijpers, P., Furukawa, T.A, & Ebert, D. D. (2019). Doing Meta-Analysis in R: A Hands-on Guide. DOI: 10.5281/zenodo.2551803. Chapter 12.
Cheung, M. W. L. (2014). Modeling dependent effect sizes with three-level meta-analyses: a structural equation modeling approach. Psychological Methods, 19(2), 211.
Examples
# Use dat.konstantopoulos2011 from the "metafor" package
library(metafor)
#> Loading required package: Matrix
#> Loading required package: numDeriv
#>
#> Loading the 'metafor' package (version 4.2-0). For an
#> introduction to the package please type: help(metafor)

# Build Multilevel Model (Three Levels)
m = rma.mv(yi, vi, random = ~ 1 | district/school, data=dat.konstantopoulos2011)

# Calculate Variance Distribution
mlm.variance.distribution(m)
#>         % of total variance    I2
#> Level 1            4.812686   ---
#> Level 2           31.862476 31.86
#> Level 3           63.324838 63.32
#> Total I2: 95.19%

# Use alias 'var.comp' and 'Chernobyl' data set
data("Chernobyl")
m2 = rma.mv(yi = z, V = var.z, data = Chernobyl, random = ~ 1 | author/es.id)
res = var.comp(m2)

# Print results
res
#>         % of total variance    I2
#> Level 1            1.254966   ---
#> Level 2           39.525499 39.53
#> Level 3           59.219534 59.22
#> Total I2: 98.75%

# Generate plot
plot(res)
